
21/04/2026
The EPO has recently released its annual patent statistics and technology dashboard. The report highlights patent filing trends at the EPO, and now features patent data up to and including 2025. A link to the EPO data is here.
In this article, we take a brief look at the main trends and comment on the most interesting findings:
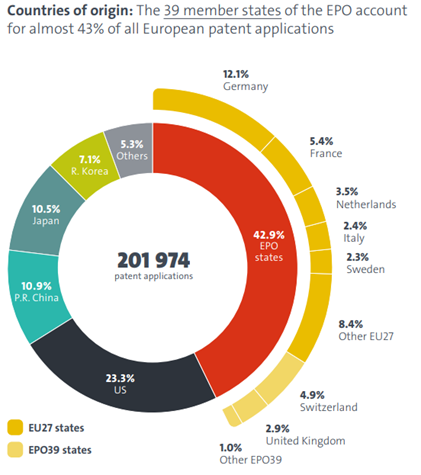
For the first time, the number of applications filed annually at the EPO has risen to over 200,000 (201,954). – more than 40,000 applications filed per year than 10 years ago. The grant rate for patents continues to be above 50% rising from the covid induced minimum in 2022. This record volume highlights Europe’s continued appeal as a global technology market.
The statistics show that the Unitary Patent continues to be popular. In 2025, the percentage of granted European patents converted into Unitary Patents was nearly 30% (28.7%) overall. When looking just at applicants from Europe, the Unitary Patent is even more popular, with an uptake of around 40%. Chinese applicants opted for Unitary Patent protection more than any other individual country on 22.6% of the share.
Graphic: EPO key Figures infographic
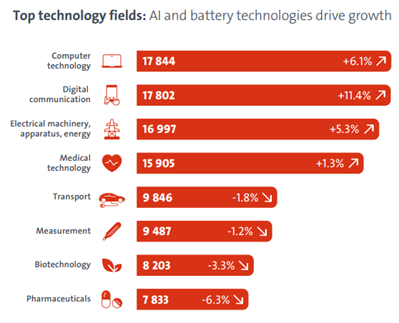
Computer technology remains the leading field, with 17,844 applications (+6.1%), driven in part by advances in AI (+9.5%) and the rapidly expanding area of quantum technologies (+37.9%). Digital communication also saw significant growth (+11.4%), fuelled by the emergence of 6G technologies, while demand for semiconductor innovations continued to rise (+7.6%).
Graphic: EPO key Figures infographic
The number of patent applications originating from Korea and China continue to experience the greatest growth. Furthermore, this year, China has become the third largest filer of patent applications (10.9%) at the EPO, after European member states (42.9%) and the United States (23.3%). Japan is now in fourth position on 10.5% of the share.
Applications from Small to Medium Enterprises (fewer than 250 employees), individual Inventors and academic institutions account for 33% of applications overall. The remaining two-thirds of the applications are filed by “large entities”. It’s particularly encouraging to see the patent system’s appeal to smaller entities, further supported by targeted fee reductions for micro-enterprises, individuals, non-profits, universities and research institutions.
This content is for general information only. Its content is not a statement of the law on any subject and does not constitute advice. Please contact Reddie & Grose LLP for advice before taking any action in reliance on it.
PDF Publication: EPO Technology Dashboard – Statistics at a glance
HTML summary: EPO Technology Dashboard 2025 | epo.org
EPO key Figures infographic : 260318-EPO-Technology-Dashboard-2025