28/03/2022
In the coming year, those applying for patents in Europe are expected to be presented with a new opportunity. Since its formation in 1977, the European Patent Office (EPO) has acted as a central examining and granting authority; it provides a single portal to apply for patent protection in 38 member countries, and, if a patent is granted, the opportunity to then validate this protection as a bundle of national patent rights in each member country where protection is desired. These validated patents must then be renewed, enforced, and revoked at a national level.
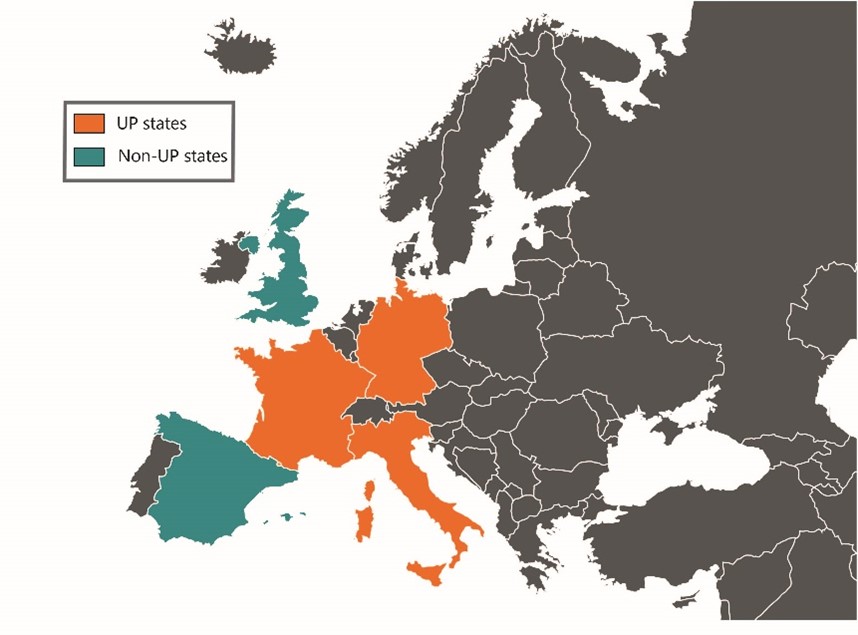
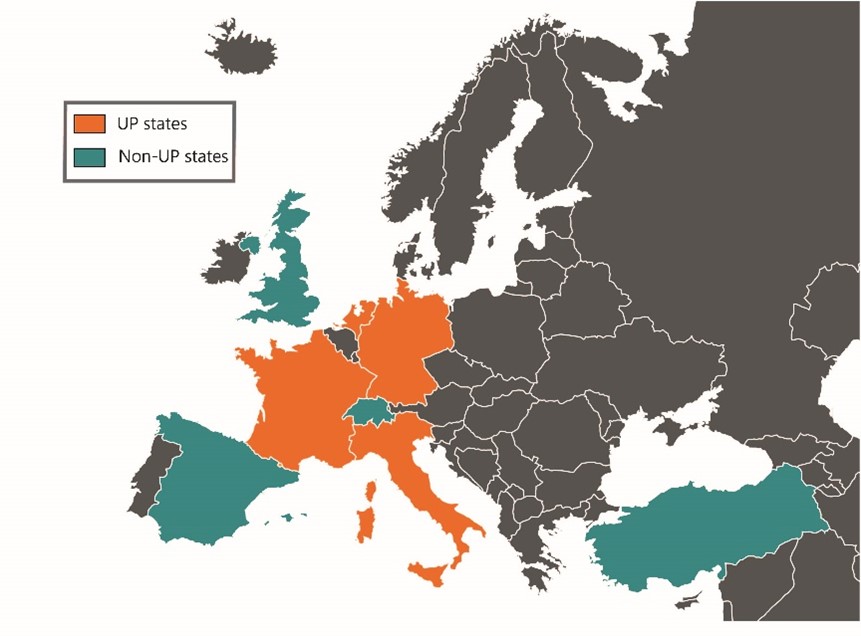
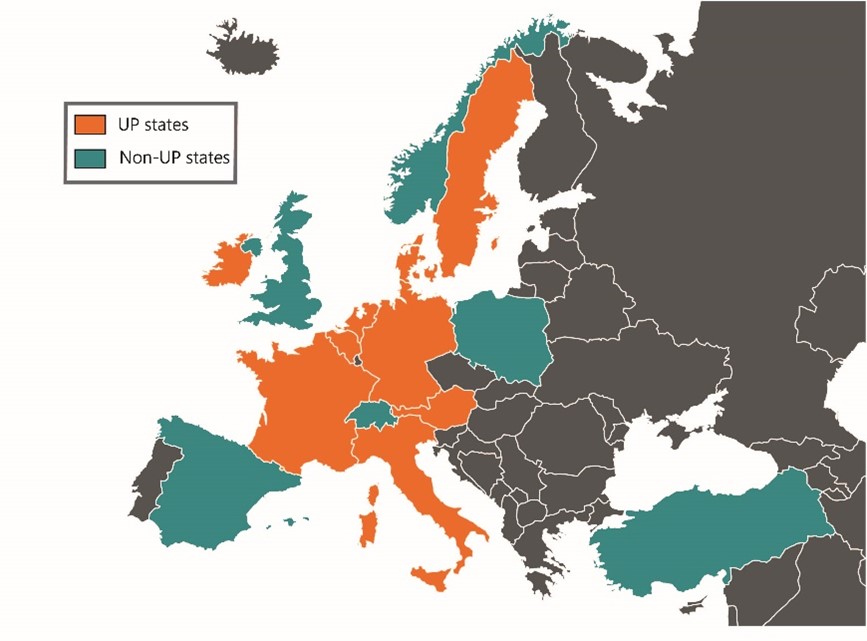
Soon, we expect this status quo to change, with applicants being offered a new option for how they validate their European patents in 17* of the existing 38 European Patent Convention (EPC) countries. For these 17 countries, instead of validating a bundle of national rights, there will be the option to obtain a single unitary right covering all 17 territories. This single (unitary) patent would be renewed as one right, with enforcement and validity proceedings being held before a single court, the Unified Patent Court. Validation in countries not participating in the unitary patent will continue to operate at the individual national level.
But will the Unitary Patent (UP) be something that users of the current European system wish to adopt? Will the pros outweigh the cons?
While the answer will be influenced by many factors specific to each applicant’s circumstances and business goals – such as enforcement, licensing and revocation opportunities – in nearly all cases, it is likely that the decision will ultimately hinge on cost. “Will the UP be a cost-effective option for me and my organisation in Europe?”
For some applicants, the cost decision will be easy. For example, if the UP offers broader territorial protection for significantly less spend than the current patent strategy, it will surely be very tempting to opt for the UP route. On the other hand, if an applicant is happy with the value derived from their current strategy in Europe, and the option of the UP is significantly more expensive, it will be difficult to justify shifting approach. Many applicants will no doubt have patent strategies sitting firmly in between these two scenarios, and decision makers in such cases must think carefully about the how the costs will stack up for them.
To help with this challenge, in the following analysis, we compare the expected costs for keeping European patents in force when using the UP, with the costs for keeping European patents in force when not using the UP, under a range of validation strategies.
Bang for your buck and measuring the value of a European patent
Before we consider these cost comparisons, we should first briefly discuss what different validations strategies might look like. In simple terms, an applicant’s validation strategy should be one that delivers the most valuable protection to them for their given budget. Whilst protection in all 38 EPC members states would theoretically be wonderful, real-world constraints mean this is almost never a viable option. Instead, each applicant must choose a select number of countries to reflect their key business interests.
The metrics influencing this decision will vary from industry to industry; big pharma may prioritise countries with the largest healthcare spend, whereas the aviation industry may only consider countries having large passenger volumes. However, one simple metric, which is likely to be important to all applicants is the size of a country’s economy or gross domestic product (GDP). How much of the available EPC member states’ GDP can an applicant access through their choice of validations? Or, put another way, how can an applicant choose their validations in a way that maximises the ‘bang for their buck’?
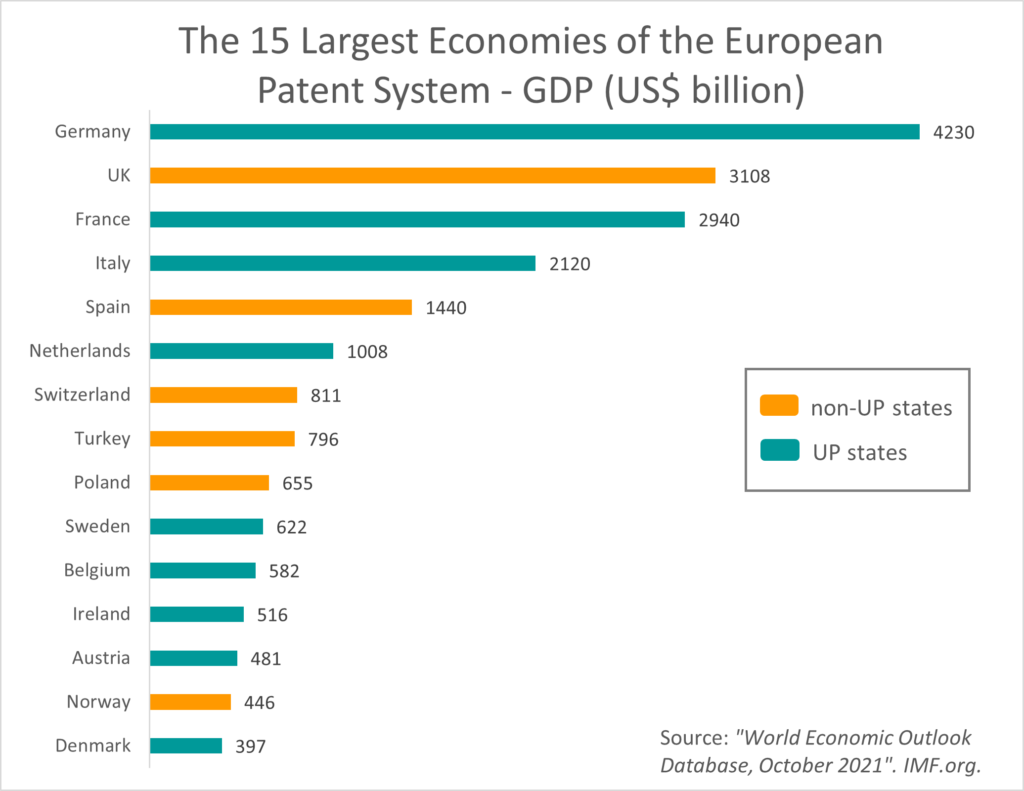
As indicated by the above chart, the 3 largest economies in Europe (Germany, the UK and France) take a dominant role and collectively account for 46 percent of the total GDP of all 38 EPC member states (i.e., total EPC GDP). Consequently, many applicants currently find that simply validating their European patents in only these 3 countries is sufficient to protect their key business interests in Europe.
Moving further down the list, the 8 largest European economies can be seen to collectively account for around 75 percent of the total EPC GDP, while the 15 largest European economies collectively account for around 90 percent of the total EPC GDP. The majority of the European economy can therefore be secured by validating in no more than 8 countries, and the vast majority can be secured by validating in no more than 15 countries.
Cost Examples
So, returning to the topic at hand: how will the costs of using the unitary patent system compare with the costs of the current national-only validation system?
At this point, we should repeat that by ‘costs’, we mean annuity or renewal costs, i.e., the fees that need to be paid on an annual basis to keep a patent in force.
The current system dictates that these fees be paid annually to the national patent office of each country where the European patent has been validated. However, with the option of a UP there will only be single annual renewal fee that needs to be paid in order to maintain protection in the 17 unitary patent territories.
UP renewal fees will be+ set at a level corresponding to the combined renewal fees of the four countries where European patents were most often validated in 2015. Clearly, this will represent a major cost saving to any applicant who already has a strategy of validating their European patent in all of the 17 UP territories. However, for applicants validating in fewer countries, the annuity cost savings (or increases) may be less clear. The following five comparative examples can help shed some light on this.
It should be noted that, because the average European patent grants around 4 years from its filing date, the below examples only consider renewal costs from the 5th year onwards.
Example A: Validation in 3 Largest EPC Economies
As a first example we consider the commonly adopted approach of only validating a European patent in the 3 largest EPC economies (Germany, the UK and France), and thereby securing protection covering about 46 percent of the total available EPC GDP.
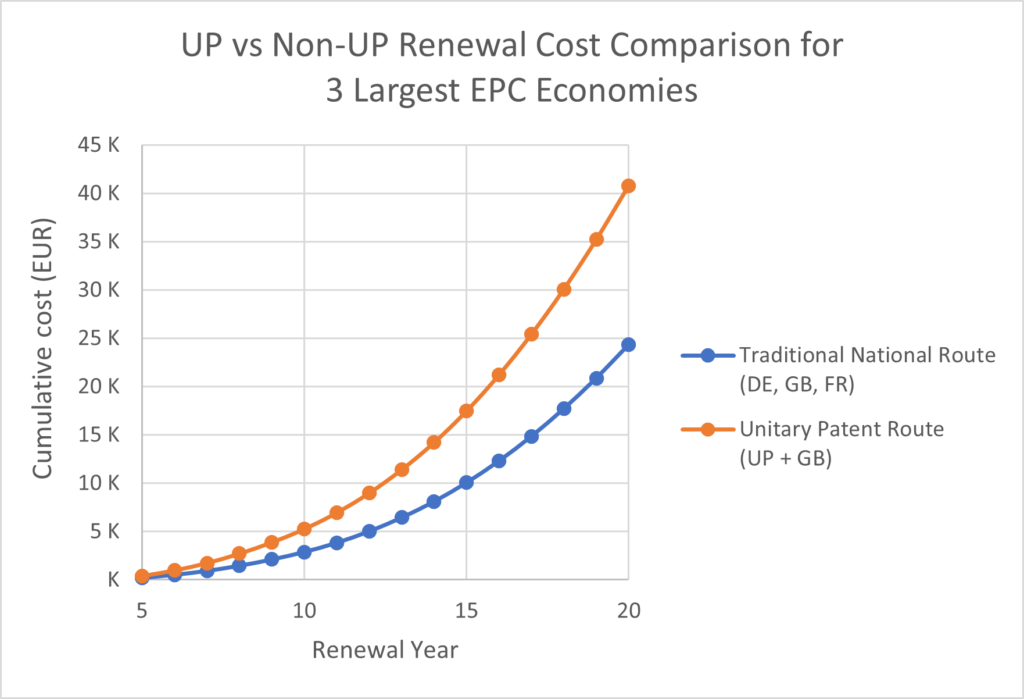
As can be seen from the above chart, the UP route clearly represents a significant cost increase on the conventional national validation route (around a 70% uplift over the lifetime of the patent), but it does come with the benefit of additional protection in 15 further European countries (i.e., the 17 UP members minus France and Germany). These further 15 countries account for 27 percent of total EPC GDP.
Consequently, applicants currently operating the validation strategy of Example A will need to determine if they are willing – or indeed able – to increase their European annuity budget by around 70% in exchange for such additional territorial protection. In some cases, this may be justifiable, but for many large organisations having portfolios of several hundred or more European patent applications, it is difficult to envisage a switch to the UP route being favoured.
Example B: Validation in 5 Largest EPC Economies
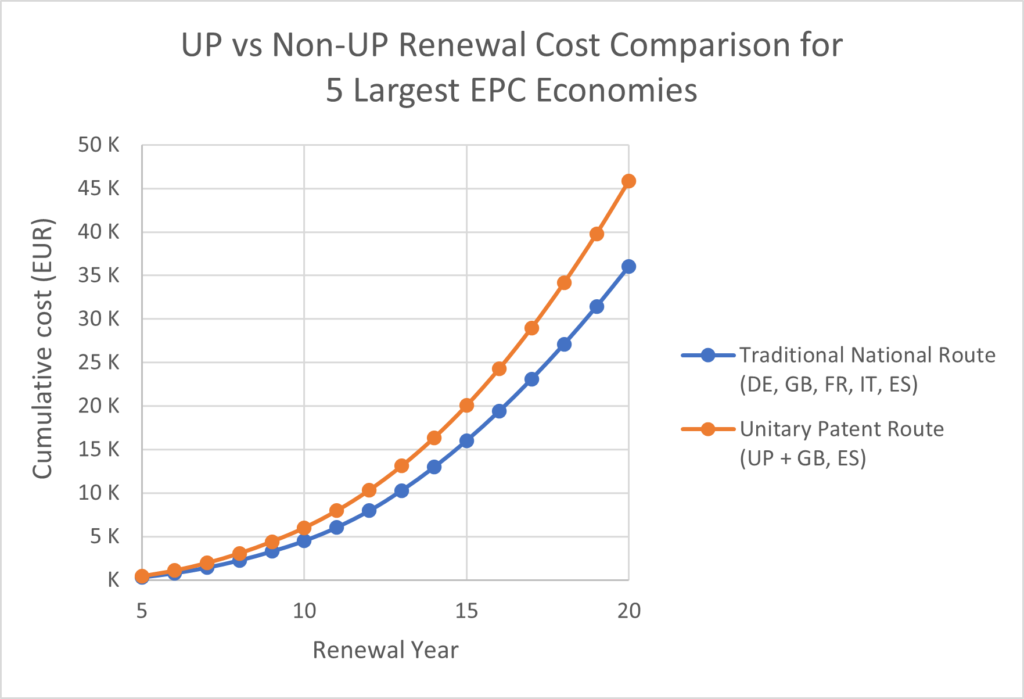
Validating in the 5 largest European economies further extends protection to Italy and Spain, and thus results in collective protection covering approximately 62 percent of the total available EPC GDP. However, because Spain is not participating in the UP, the cost of switching to the UP route remains noticeably increased over the traditional national route (around a 30% uplift over the lifetime of the patent). Under Example B, the UP would offer additional protection in 14 further European countries, collectively accounting for 18 percent of total EPC GDP.
Consequently, IP decision makers in organisations currently operating the validation strategy of Example B may also face difficulty in securing the budget required for a switch to the UP route.
Example C: Validation in 8 Largest EPC Economies
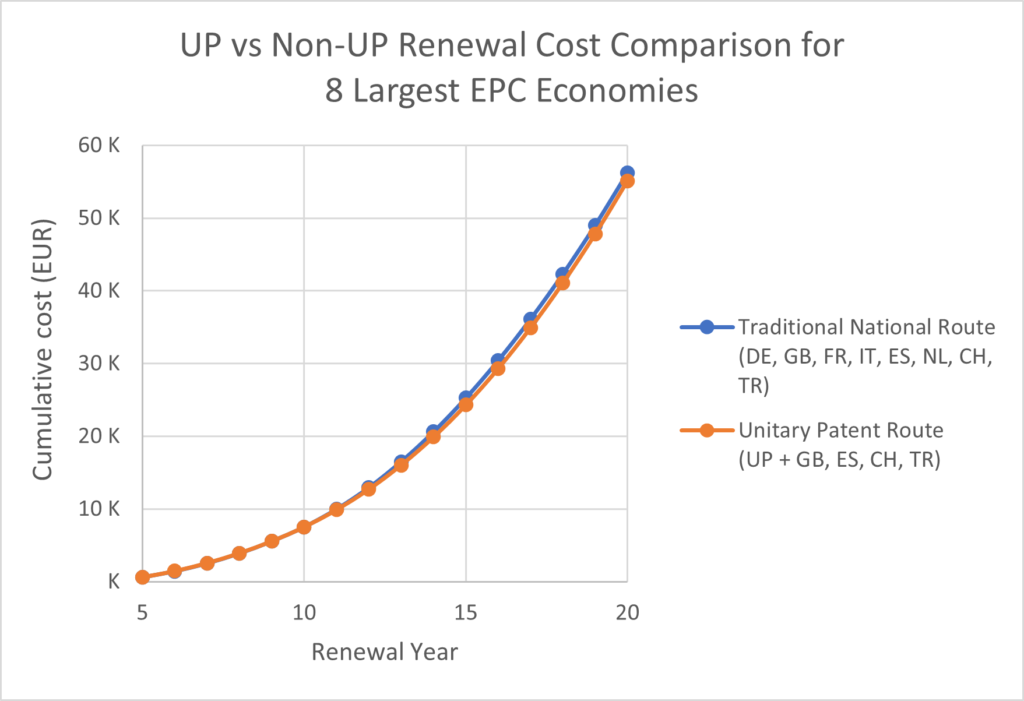
Example C further extends protection to the Netherlands, Switzerland and Turkey, and represents a point where maintenance costs under the UP route begin to more closely match those of the traditional national validation route. This is, to some extent, expected since the introduction of the Netherlands now means that 4 UP member states are present in the target validation list of Example C. With the UP renewal fees being set at a level roughly equivalent to the total of four national validation renewal fees+, it is logical for Example C to be a scenario where the UP route stops being more expensive than the traditional national validation route.
Applicants currently operating the validation strategy of Example C will therefore be understandably tempted to switch to the UP route, as it would in effect offer them additional protection in 13 further countries for substantially no further cost. These 13 further countries collectively account for around 13 percent of total EPC GDP.
Such applicants should, however, be wary of the fact that (unlike the traditional bundle of national patents), a UP cannot be selectively abandoned in only some member states in order to save on renewal costs. Consequently, if (after validating a European patent through the UP route) an applicant found that protection in, say, Italy and the Netherlands was no longer commercially important, the applicant would not be able to abandon their UP in only Italy and the Netherlands to save on renewal costs. Their only options would be to either: A) abandon the UP in its entirety and this forgo potentially valuable protection in the likes of France and Germany; or B) maintain the UP in its entirety and thus be subject to its higher individual renewal costs. The UP route will therefore offer less flexibility when it comes to the common cost saving exercise of ‘trimming’ a patent portfolio over time.
Example D: Validation in 10 Largest EPC Economies

Example D further extends protection to Poland and Sweden, and represents a point where maintenance costs under the UP route clearly become cheaper than those of the traditional national validation route (around a 10% cost saving over the lifetime of the patent). The cost savings would be even greater if it were not for the fact that Poland is not participating in the UP.
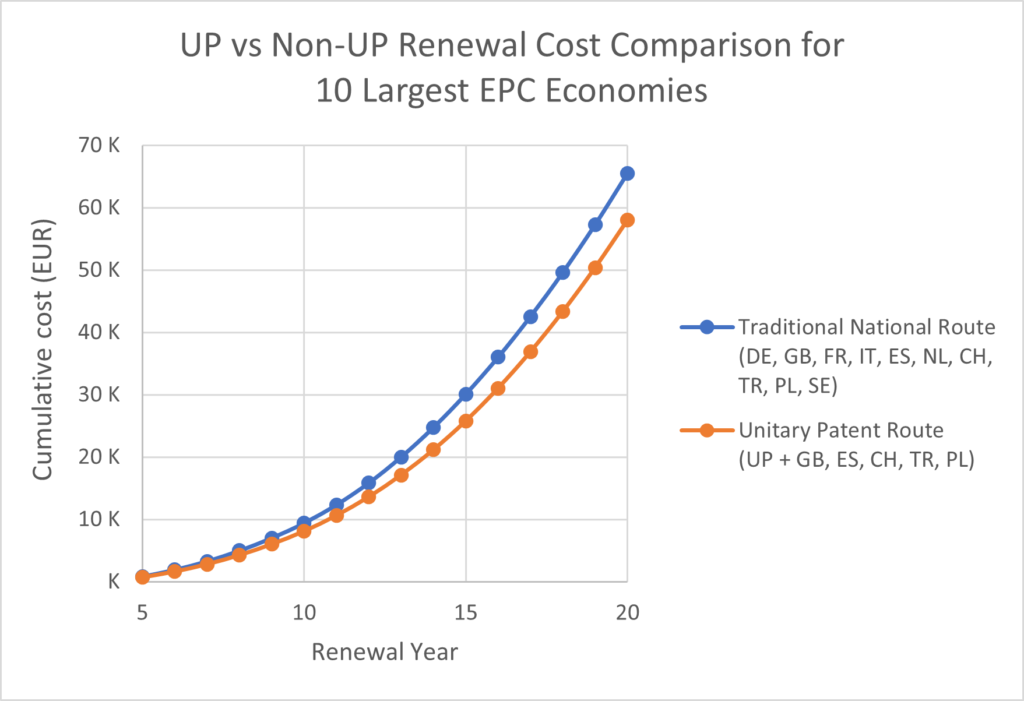
Therefore, applicants currently following the validation strategy of Example D, could expect to make a 10% saving in annuity costs, whilst also gaining additional protection in 12 further European countries. These 12 further countries account for 10 percent of total EPC GDP. For context, this 10% equates to a sum, which is larger than the GDP of the likes of Canada, South Korea and Brazil.
Consequently, at least from an annuity costs perspective, the UP is likely to be appealing to those applicants who currently validate their European patents in line with the strategy of Example D.
Example E: Validation in 15 Largest EPC Economies
Finally, Example E concerns a strategy of validation in all of the top 15 EPC economies, and thus further extends protection to Belgium, Ireland, Austria, Norway and Denmark. This is clearly a scenario where maintenance costs under the UP route are significantly cheaper than those of the traditional national validation route (around a 35% cost saving over the lifetime of the patent).
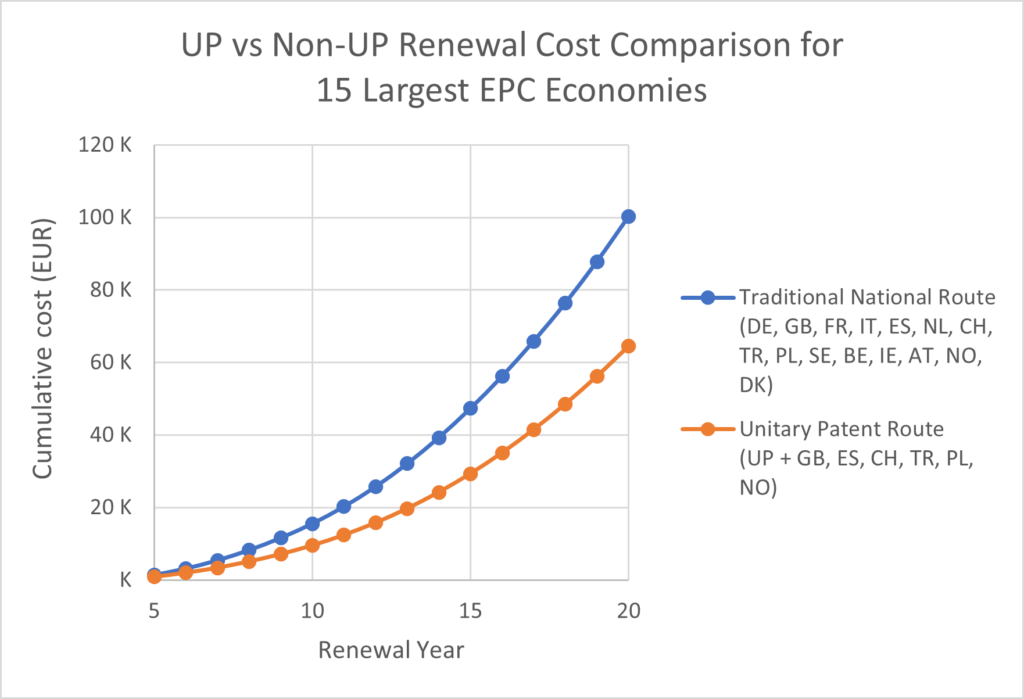
In this scenario, the UP route would of course also offer additional protection in 8 further European countries, which collectively account for 4 percent of total EPC GDP. Applicants currently following the validation strategy of Example E may have limited interest in such extra territorial protection; however, the significant cost savings on renewal fees will likely make the UP route an extremely tempting proposition.
Simplified Comparison
The following chart contains some of the key take-home points from Example scenarios A to E, and provides a simple visual illustration of the relative cost increase or decrease that can be expected from switching to a validation strategy that involves the Unitary Patent. For each example validation strategy, the percentage cost increase/decrease is shown at 10 years, 15 years and 20 years from the filing date of the patent.
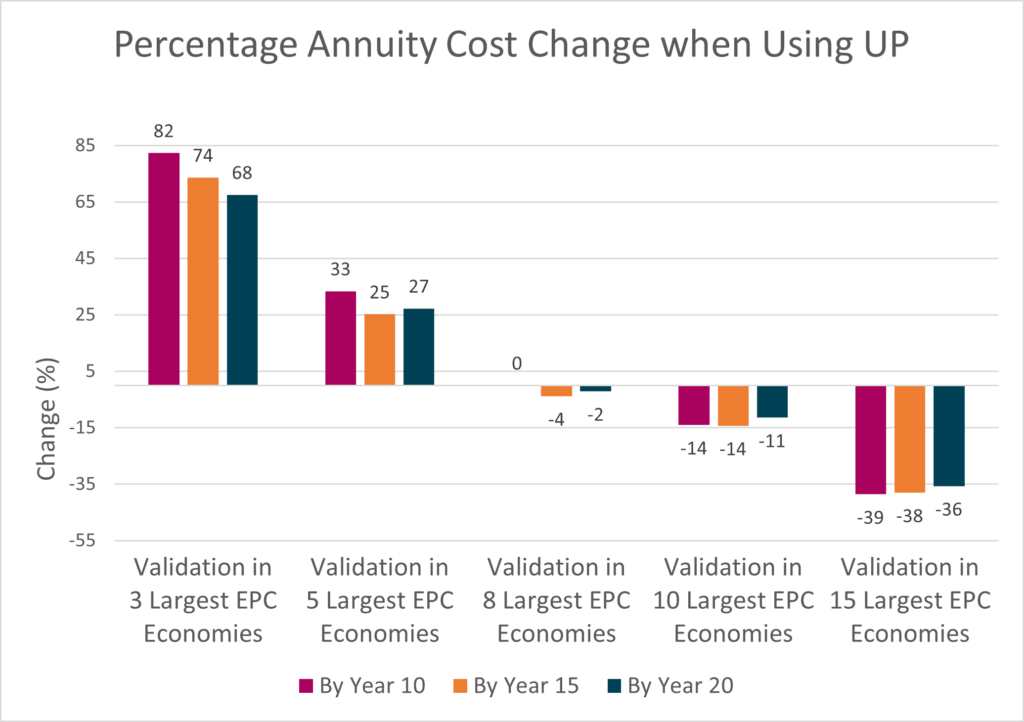
The chart illustrates the general trend discussed above in respect of Example scenarios A to E, namely: existing validation strategies covering fewer than 8 of the top EPC economies are expected to involve a cost increase under the UP route, whereas existing validation strategies covering more than 8 of the top EPC economies are expected to involve a cost decrease under the UP route. However, there are also other noteworthy points that can be drawn from the chart. For instance, interestingly, the percentage cost increase/decrease does not remain constant throughout the life of the patent. For example, with Example A, which concerns validation in only the 3 largest EPC economies, the percentage cost increase of using the unitary patent is highest in the earlier years of the patent (82% at year 10), but progressively drops (to 68%) as the patent matures towards its 20-year expiry point.
Similarly, looking to the right-hand side of the chart and the data points for Example E (validation in the 15 largest EPC economies), it can be seen that the biggest percentage cost savings occur in the early years of the patent (i.e., those leading up to year 10). Most patents are not renewed by applicants all the way through to their 20-year maximum term date. Consequently, readers attempting to use the above chart to determine their own potential cost increases/decreases may wish to pay particular attention to the earlier year data points, as these may well be the ones that will affect them/their organisations most in practice. In that regard, it is worth noting that, with Example C (validation in the 8 largest EPC economies), effectively no cost saving on official annuity fees is to be expected within the first 10 years of the patent.
Further Considerations
The above analysis solely concerns the official renewal fees that are payable to patent offices, and the relative differences in these when using or not using the unitary patent. The material is intended to provide a useful starting point for an organisation when determining whether or not the UP is the right option for them. However, in addition to such costs, there are many other factors, which need to be carefully considered. With offices in London, Cambridge, Munich and The Hague, Reddie & Grose’s extensive team of European patent attorneys are perfectly placed to help. Please get in touch if you would like further information.
Footnote:
* The Unitary Patent is only available for members of the European Union (EU) and is expected to start with 17 participating members, but with the potential for 7 further members (Ireland, Czechia, Slovakia, Hungary, Romania, Greece and Croatia) to also join at a later date.
+ https://www.epo.org/law-practice/unitary/unitary-patent/cost.html
This article is for general information only. Its content is not a statement of the law on any subject and does not constitute advice. Please contact Reddie & Grose LLP for advice before taking any action in reliance on it.