15/06/2021
This article is the second in our renewable energy patent tracker series. The first, published early March 2021, compared patent trends for renewable energy generation technology from 2016 to 2020 with data from the first two months of this year. Using the Y02 classification scheme developed by the EPO for labelling climate change mitigation technologies, we compared the number of publications in different renewable energy fields (solar PV, solar thermal, wind, geothermal, hydro and from the sea) and ranked the biggest patent filers in these areas. In this instalment, we update our statistics for this year, incorporating data from up until the 19th May, and extend our trend analysis over the ten years leading up to 2021.
Number of publications by field
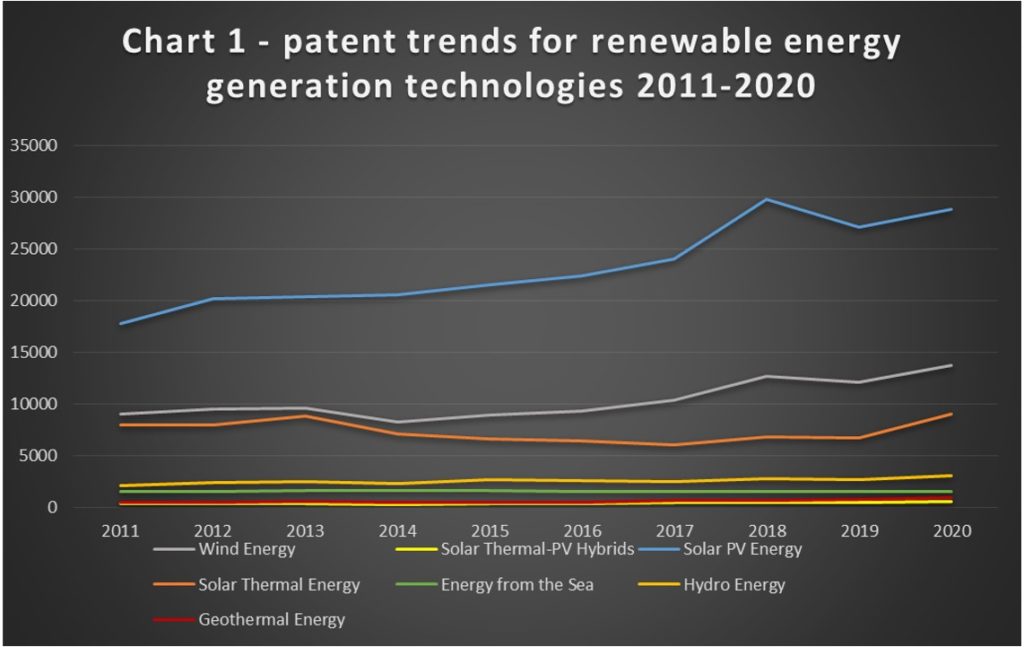
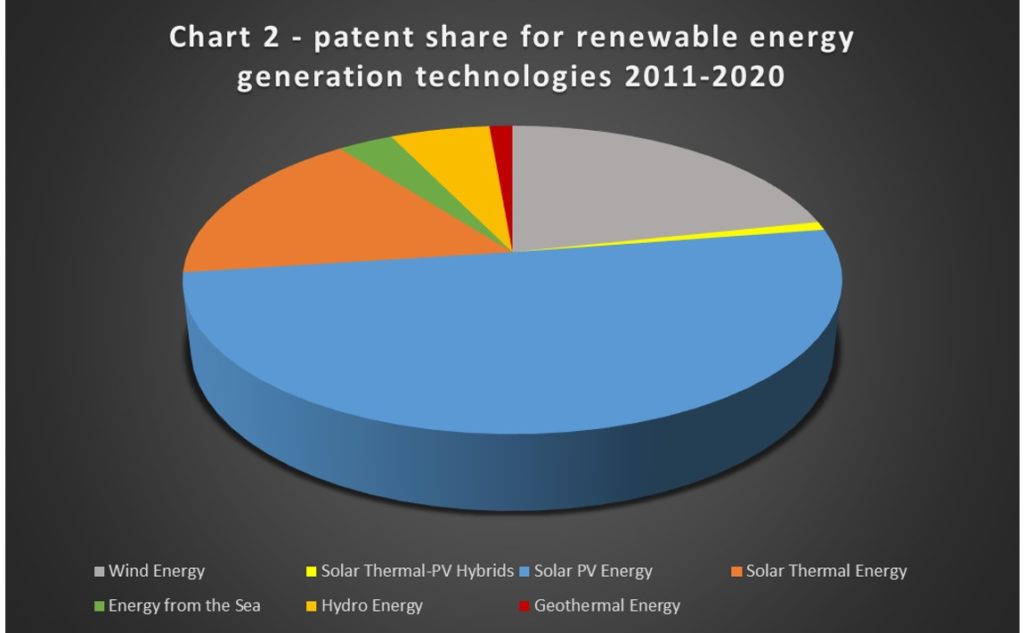
Chart 1 above illustrates the annual number of publications related to different forms of renewable energy generation. Chart 2 then shows the overall proportion linked to each field. In our previous patent tracker feature, we looked at filings published during the 5 year period from January 2016 to December 2020. We noted that solar PV dominated, accounting for well over half of all publications over that time frame. We have now extended our analysis to cover the 10 years from January 2011 to the end of 2020. This is a particularly interesting period which covers the lead up to the Paris Agreement, an international treaty on climate change mitigation, and its entry into force in 2016. Keeping in mind that there is generally an 18 month delay between filing a patent and its subsequent publication, the Paris Agreement may account for the relatively sharper increase in solar PV and wind publications observed between 2016 and 2018 (see Chart 1).
Even having extended our analysis to cover the 10 years leading up to 2021, each renewable energy generation field maintains its rank in terms of its share of patent publications when comparing Chart 2 to its equivalent in our March patent tracker feature. Obtaining the bigger picture, however, does reveal trends previously obscured by only looking at publications from 2016 to 2020. Notably, solar thermal publications appear to be recovering from a relatively steady decline, with 2020 having brought the highest number of publications within this time period. This may suggest renewed interest in this area.
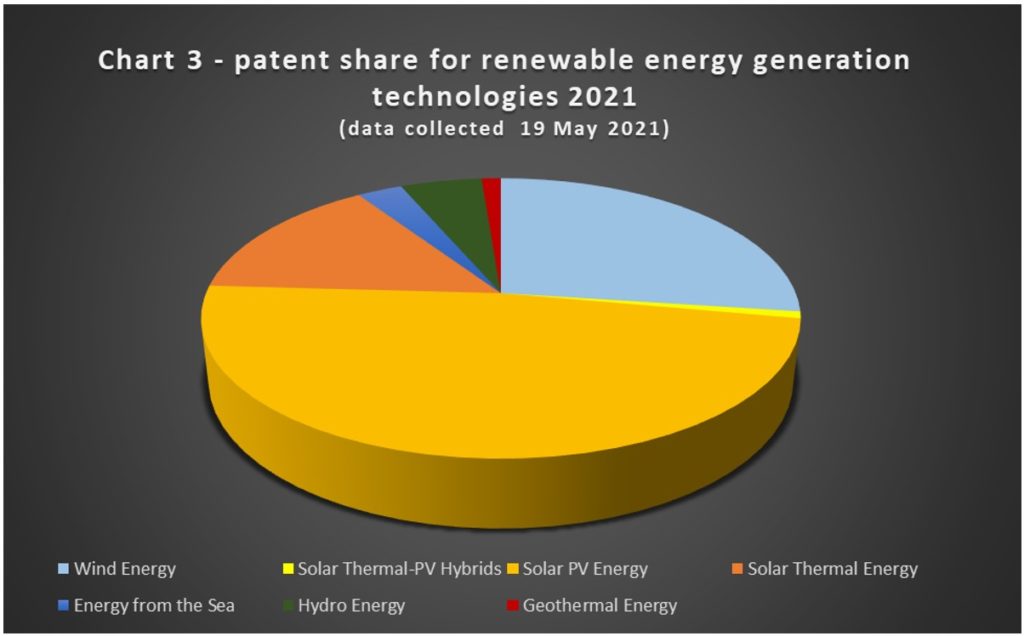
Chart 3 displays the share of publications associated with the same industries for the first few months of 2021. The data continues to support some of the tentative conclusions drawn in March’s patent tracker feature. Notably, the proportion of solar PV publications, which remained above 50% from 2014 to 2020, now sits below half. In contrast, the share of publications related to wind energy generation is currently higher than it has been for the last 10 years, supporting the hypothesis of increased innovation in this area.
The figures for solar thermal energy and the remaining fields remain relatively consistent with those in Chart 2, indicating sustained interest. Early data from 2021 published in our March patent tracker feature suggested a significant decrease in the share of publications held by solar thermal energy. It is promising to see that the proportion increased from 6% to 17% as 2021 progressed.
Such recent data does, however, have to be viewed with caution. Some patent offices may take longer to provide details of published patent applications than others. This has the potential to skew the data, especially where filings for the different technology areas are being made in different areas around the world.
Country of publication
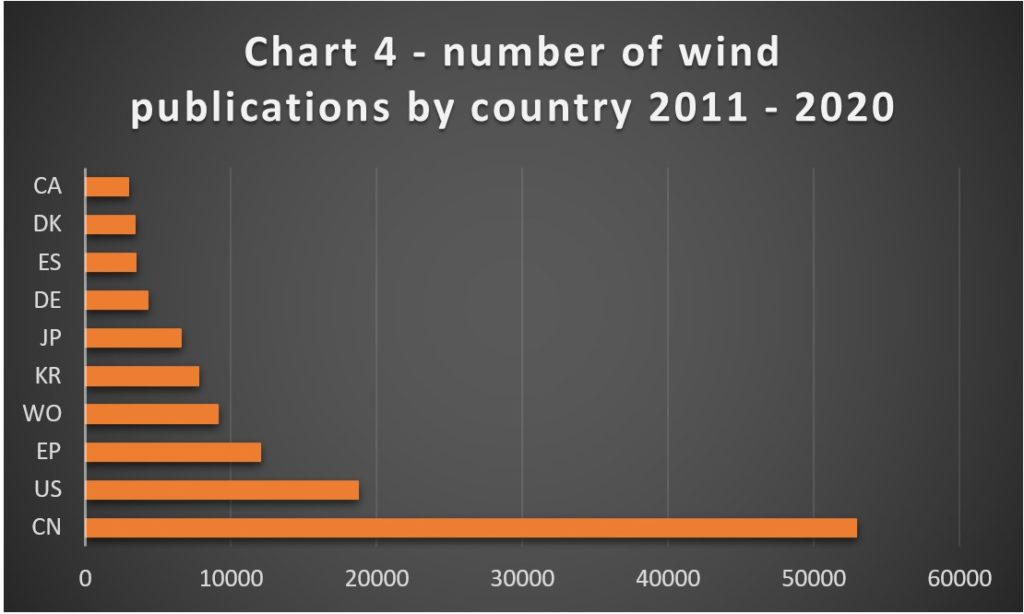
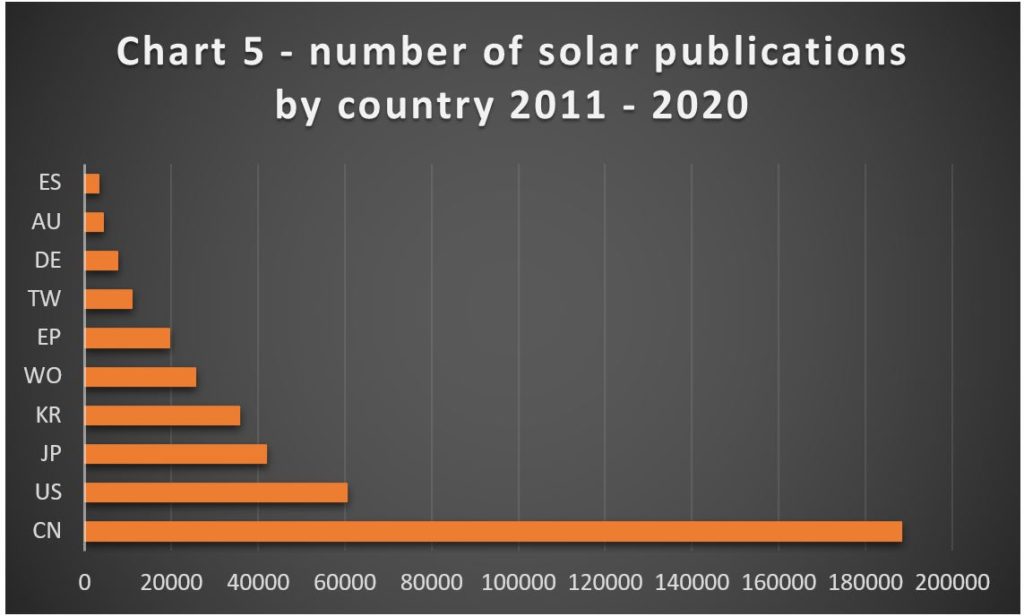
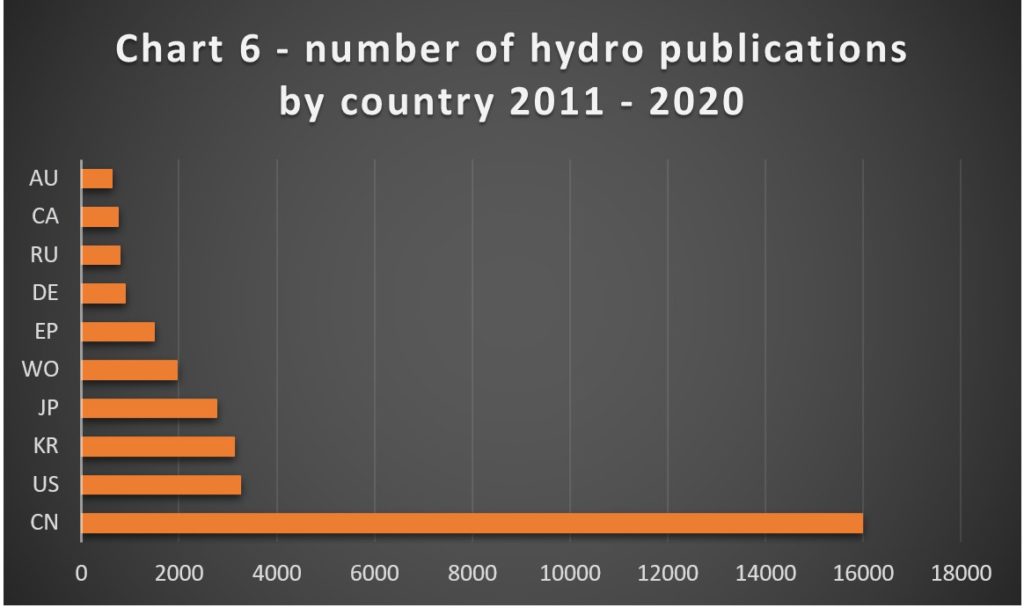
Charts 4, 5 and 6 respectively illustrate the number of publications related to wind, solar and hydro renewable energy generation from 2011 to 2020 by country of publication. We have only included the 10 countries associated with the highest number of publications and Chart 5 combines figures for solar PV, solar thermal and solar thermal-PV hybrids.
Perhaps unsurprisingly, China dominates all three charts. Taking data published by the International Renewable Energy Agency, China has produced the most electricity from renewable sources every year between 2011 and 2018. A 2019 UN report on Global Trends in Renewable Energy Investment also named China as ‘by far’ the biggest investor in renewable energy since 2012.
From the above charts, the margin by which China leads the way for publications related to hydro energy is larger than that for wind and solar. This may be attributed to the fact that renewable hydropower is currently China’s largest source of renewable energy, accounting for an incredible 66% of electricity generated from renewable sources in China in 2018, for example. For the purpose of comparison, renewable hydropower only accounted for 40% in the United States.
Top filers
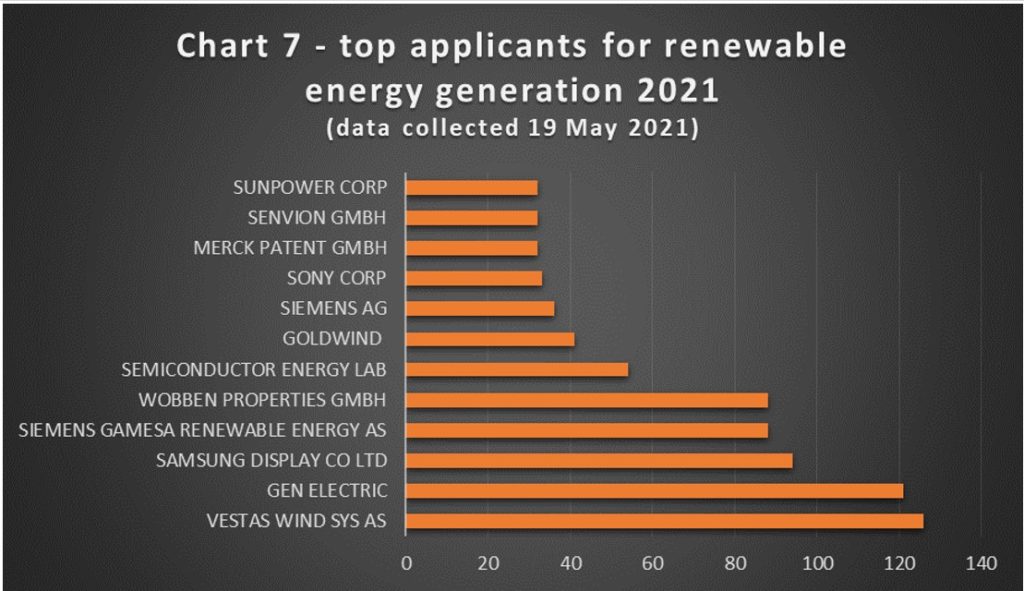
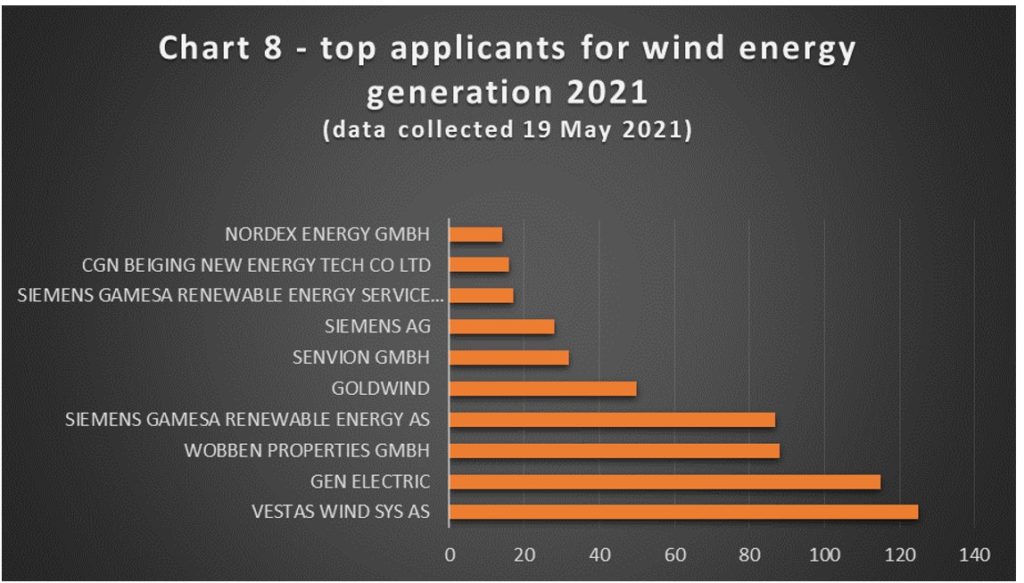
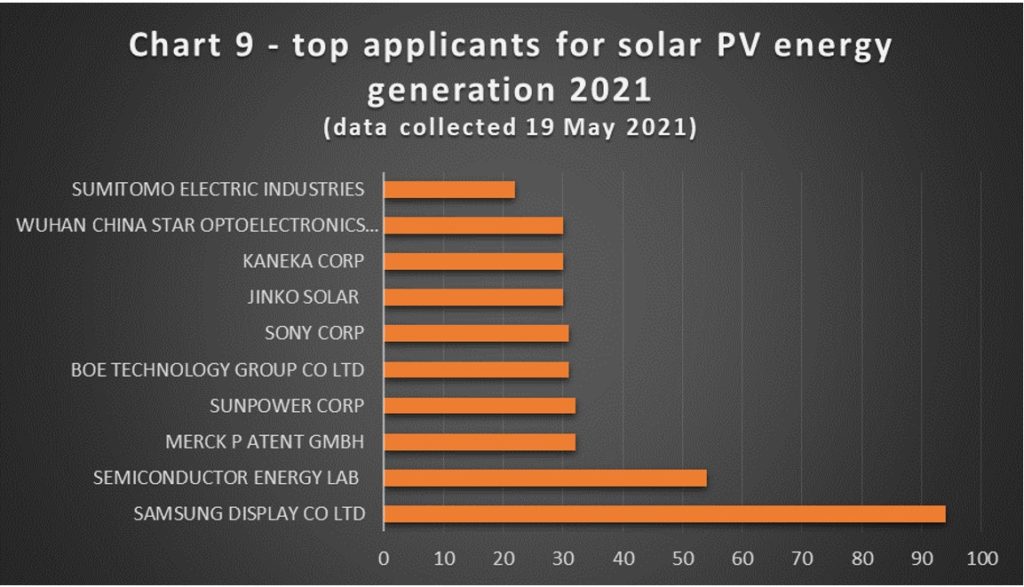
Chart 7 displays the top filers for renewable energy publications in 2021 so far, and Charts 8 and 9 rank the top filers for publications related respectively to solar PV and wind energy. Corresponding graphs covering the years 2016 to 2020 can be found in our March patent tracker feature.
Although we are yet to obtain the full picture, when comparing the 2021 top filers published in our March feature with this month’s, eight of the same applicants are replicated for publications related to solar PV energy and ten of the same for wind energy.
State Grid, which dominated both solar PV publications from 2016 to 2020 and renewable energy publications in general, is still notably absent, with Samsung Display Co taking the lead so far this year. Vestas Wind Systems, which filed the second highest number of wind related patents published between 2016 and 2020, currently occupies the top spot for wind energy and, indeed, for renewable energy in general for 2021. General Electric, another top wind filer, follows closely, supporting other indications of increased innovation in the wind sector. It will be interesting to see how these rankings develop over the remainder of this year, and whether State Grid returns to the top as the data for 2021 matures.
What new technology are we seeing?
In our last patent tracker feature, we looked at wind classification codes to gain an idea of what new technology we could expect in 2021. This time we focus on solar PV renewable energy generation. US based solar energy company SunPower, for example, is a top filer in this area, ranking fourth place in Chart 9. Their 2021 publications so far cover a diverse range of solar PV related technology, some examples of which are provided below.
US 2021/117587 A1 relates to modelling solar energy production data. Through a user interface, homeowners or sales representatives can modify a solar power system design (e.g. by adding/removing panels) and see the corresponding solar energy production update. This is achieved by determining solar panel placement using information such as the weather at a particular installation location, and latitude/longitude.
US 2021/057595 A1, on the other hand, relates to a device for fabricating a string of solar cells that are conductively connected by metal ribbons and arranged in a shingled manner. The device prepares, inspects and bonds metal ribbon onto solar cells during assembly of the device, increasing yield and reducing labour costs.
US 2021/111672 A1 relates to yet another technical area – that of mapping the location of PV modules. A location testing module determines their relative positions by sending a signal to the modules and having sensors measure and report a received voltage, current or frequency from which their location can be determined.
US 2021/0104643 A1 is an example of the circular economy in action, adding to SunPower’s green credentials. This application relates to methods of recycling silicon swarf (particles produced when sawing silicon ingots to produce wafers) into electronic grade polysilicon or metallurgical-grade silicon. This brings silicon by-products back into the PV value stream.
From the above, we can see just how varied the recent solar PV technology being developed by SunPower is.
At Reddie & Grose, our experienced multidisciplinary team are well placed to advise on IP strategy, as well as seeking and securing patent protection for diverse climate change mitigation technologies. We plan to make this patent tracker a regular feature. Are there other areas of interest, or areas we could cover in more detail? Please get in contact with your feedback and questions.
This article is for general information only. Its content is not a statement of the law on any subject and does not constitute advice. Please contact Reddie & Grose LLP for advice before taking any action in reliance on it.